How We Value Players
A short tour of the BaseState Player Value Model, the model behind every number on this site, with a link to the full technical white paper.
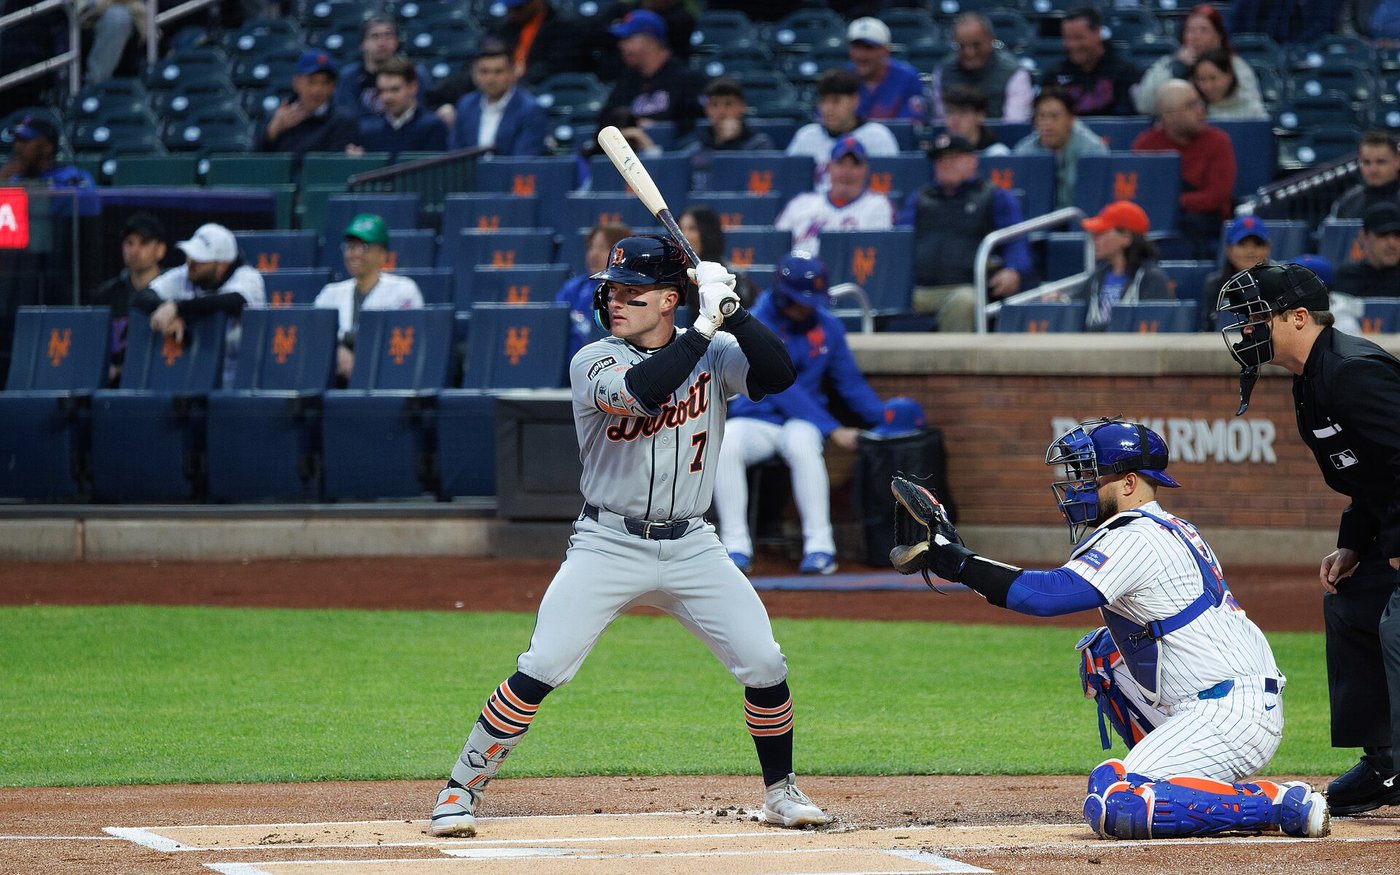

Every leaderboard, projection and player page on this site comes from one model: the BaseState Player Value Model. This post walks through how it works in a few minutes. The technical white paper has the full version, with every formula and the tests behind each choice.
One currency: runs
Every player is measured in runs above or below a league-average player: per plate appearance for hitters, per batter faced for pitchers. Zero is average, not replacement level. Because every piece is measured against the league, the whole league adds to zero, and the players on a club add up to that club's total.
The model is built from the complete MLB play-by-play for every regular-season game since 2014, rebuilt one plate appearance at a time and checked against every final score. Fielding and position inputs come from FanGraphs.
Context-neutral
A single is worth what a single is worth on average, whether the bases were empty or loaded. When a hit happened is mostly luck, and luck does not repeat from year to year, so timing is left out. In practice:
- A hitter isn't credited for when his hits came.
- A pitcher isn't charged for the fielders behind him.
- A runner is credited for what he did compared with an average runner on the same kind of ball.
The pieces
Hitters are rated on batting, situational outs (avoiding double plays, moving runners, scoring the runner from third), baserunning and fielding. Catchers also get framing, blocking and throwing. A position adjustment puts a shortstop and a first baseman on the same scale, and it stays out of team totals because every team fields one of each.
Pitchers are rated on strikeouts and walks, the quality of contact they allow (from exit velocity and launch angle), and the running game. What happens to a ball in play after contact belongs to the fielders.
Every piece is also split by the hand of the opposing pitcher or batter, and the splits add back up to the total.
How we know it works
- Our batting runs match FanGraphs' batting runs closely (r = 0.986 in 2026).
- Add up every player on a team and the total tracks the team's actual run differential (r = 0.92 in 2026). The gap is what the model leaves out on purpose: timing, home-run luck, and fielding no player is credited with.
The projections
The 2027 projections use the same currency. They blend three seasons of each player's record, pull every piece toward average by how much it actually repeats, and age each piece with its own curve. Pitchers' strikeouts, walks and contact are pulled toward what their pitch tracking predicts, minor leaguers come in through a translation of their Triple-A and Double-A seasons, and playing time comes from FanGraphs' Depth Charts. Tested out of sample on 2026, the typical miss for regular hitters fell from 27.6 runs per 600 plate appearances (using last year's rate) to 16.9, and for pitchers from 17.0 to 13.0 runs per 600 batters faced.
Read more
The technical white paper covers all of this in depth: the play-by-play reconstruction, run expectancy, each component, aging curves, the minor-league translation, validation, and how the model compares with other systems. For quick definitions of every column, see the glossary.