Is Pitchability Real?
Some pitchers keep beating what their stuff says they should do. We tested whether that's a skill, where it shows up, and what it is.
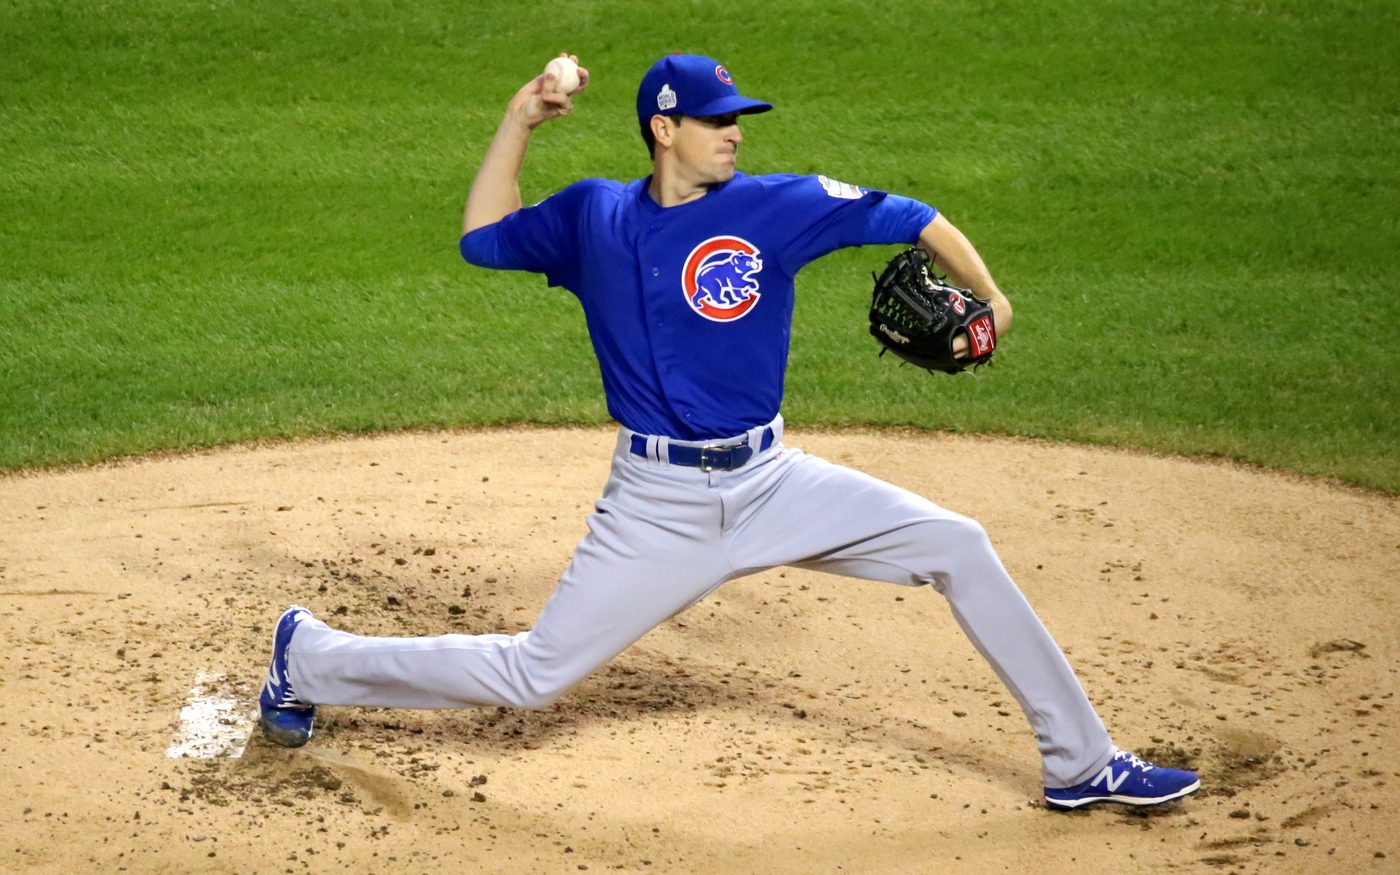

Pitch-quality models such as Stuff+ have changed how pitchers are judged. Measure a pitch's velocity, movement, spin and release, and you can predict a lot about how hitters will fare against it, often better than a season of results can. But every year some pitchers keep beating what their stuff says they should do. Ranger Suárez doesn't throw hard. Kyle Hendricks threw even softer. Both kept getting outs anyway.
Scouts call that pitchability: command, sequencing, setting hitters up, making pitches look alike until they don't. Skeptics call it noise, the pitchers who happened to get lucky and stayed in the league long enough to get noticed.
We tested it on every tracked pitch from 2021 through 2026, about 4.3 million of them, in four steps. Does beating your stuff repeat? Where does it show up? What is it? And does it belong to the pitcher, or to his catcher and club?
What "beating your stuff" means
Every pitch changes a hitter's odds. A first-pitch strike makes a strikeout likelier, a 3-1 ball makes a walk likelier, and a ball in play is worth what its exit velocity and launch angle say it should be. The BaseState model measures each pitch in runs, the same currency as the rest of this site.
Then we asked what each pitch should have been worth from its stuff alone: velocity, movement, spin, extension, release point and how it differs from the pitcher's fastball, in that count and against a hitter on that side. A pitcher's over-performance is what his pitches actually did minus what his stuff predicted, in runs per 600 batters faced (about a full season for a starter).
Two rules keep this honest. Every season is judged by a stuff model fitted on other seasons, so a pitcher's results never shape the yardstick they're measured against. And every result below is compared with what pure chance produces: we shuffle plate appearances among pitchers hundreds of times and see how often the pattern appears anyway.
Beating your stuff repeats
If over-performance were luck, a pitcher who beat his stuff one year would be no likelier to do it the next. That isn't what happens.
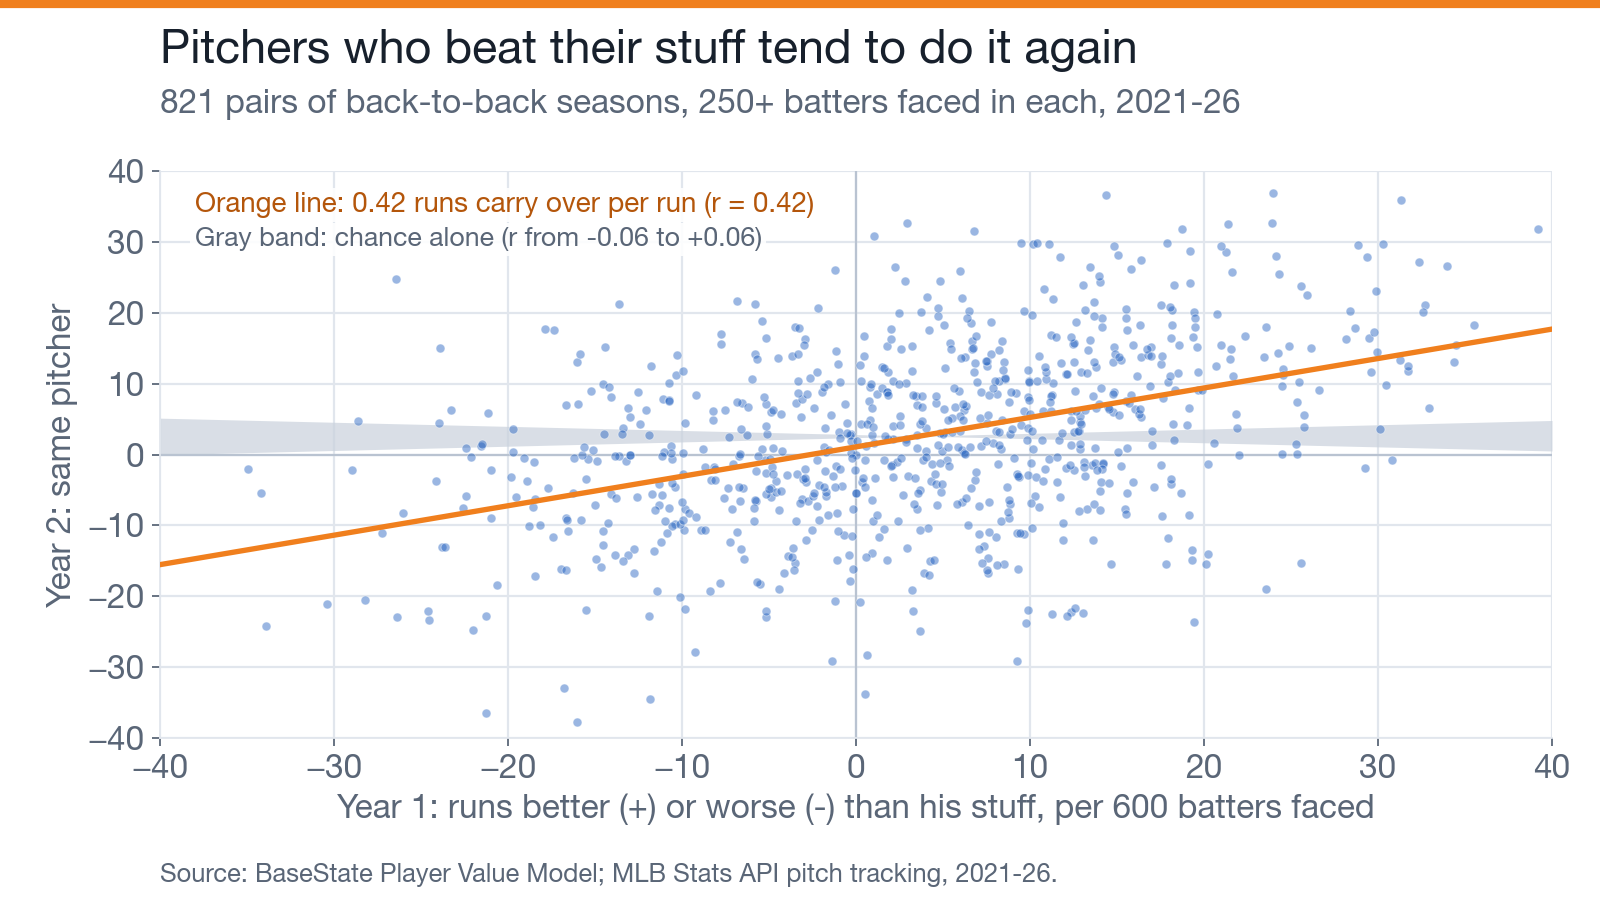
- The year-to-year correlation is 0.42. Chance alone produces something between -0.06 and +0.06. Not one of 500 shuffles came close.
- A pitcher who beats his stuff by 10 runs one season beats it by about 4 the next.
- It held in every pair of seasons, from 0.30 (2022 to 2023, the pitch-clock changeover) to 0.49.
- Of 156 pitchers with four or more full seasons, 37 beat their stuff in every one. Chance would produce two to seven percent of that group, not 24%.

The stable spread between pitchers is about 9 runs per 600 batters faced. Only about 28% of the stable differences in pitcher results come from stuff, at least as our stuff model measures it.
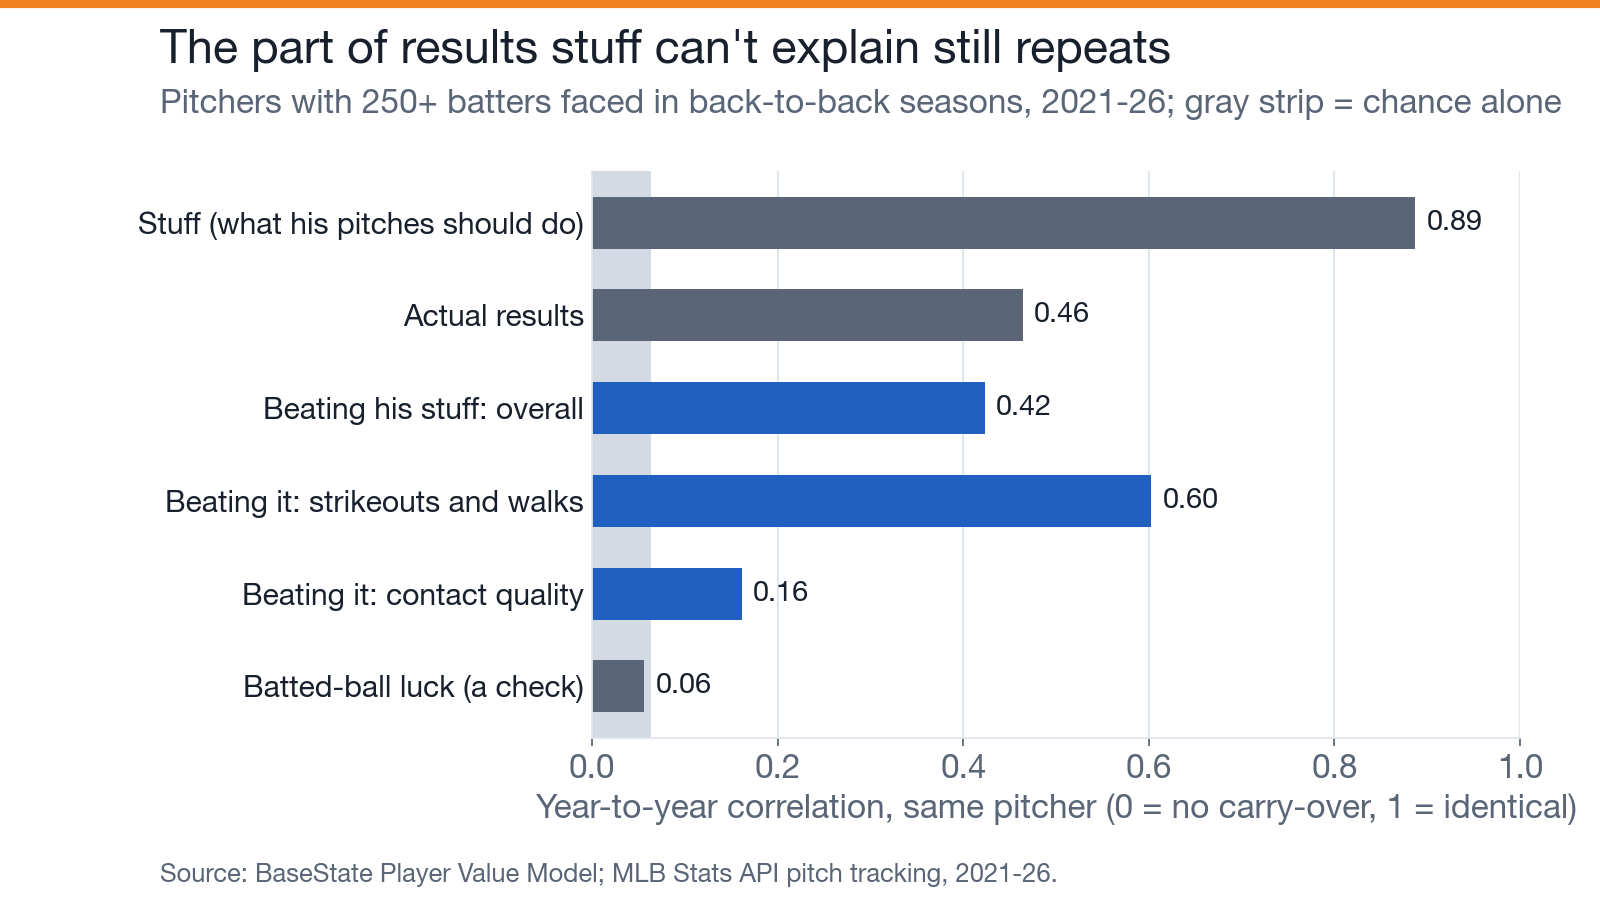
Stuff itself barely changes from year to year (0.89), and results repeat at 0.46. Beating your stuff repeats almost as well as results do, and most of it comes through strikeouts and walks (0.60). Beating your stuff on contact quality barely repeats (0.16). Our check, batted-ball luck after exit velocity and launch angle, doesn't repeat at all (0.06), as it shouldn't.
The soft-tossers who stick
One pattern stands out. Among pitchers with 1,000 or more batters faced, the softer the stuff, the more they beat it.
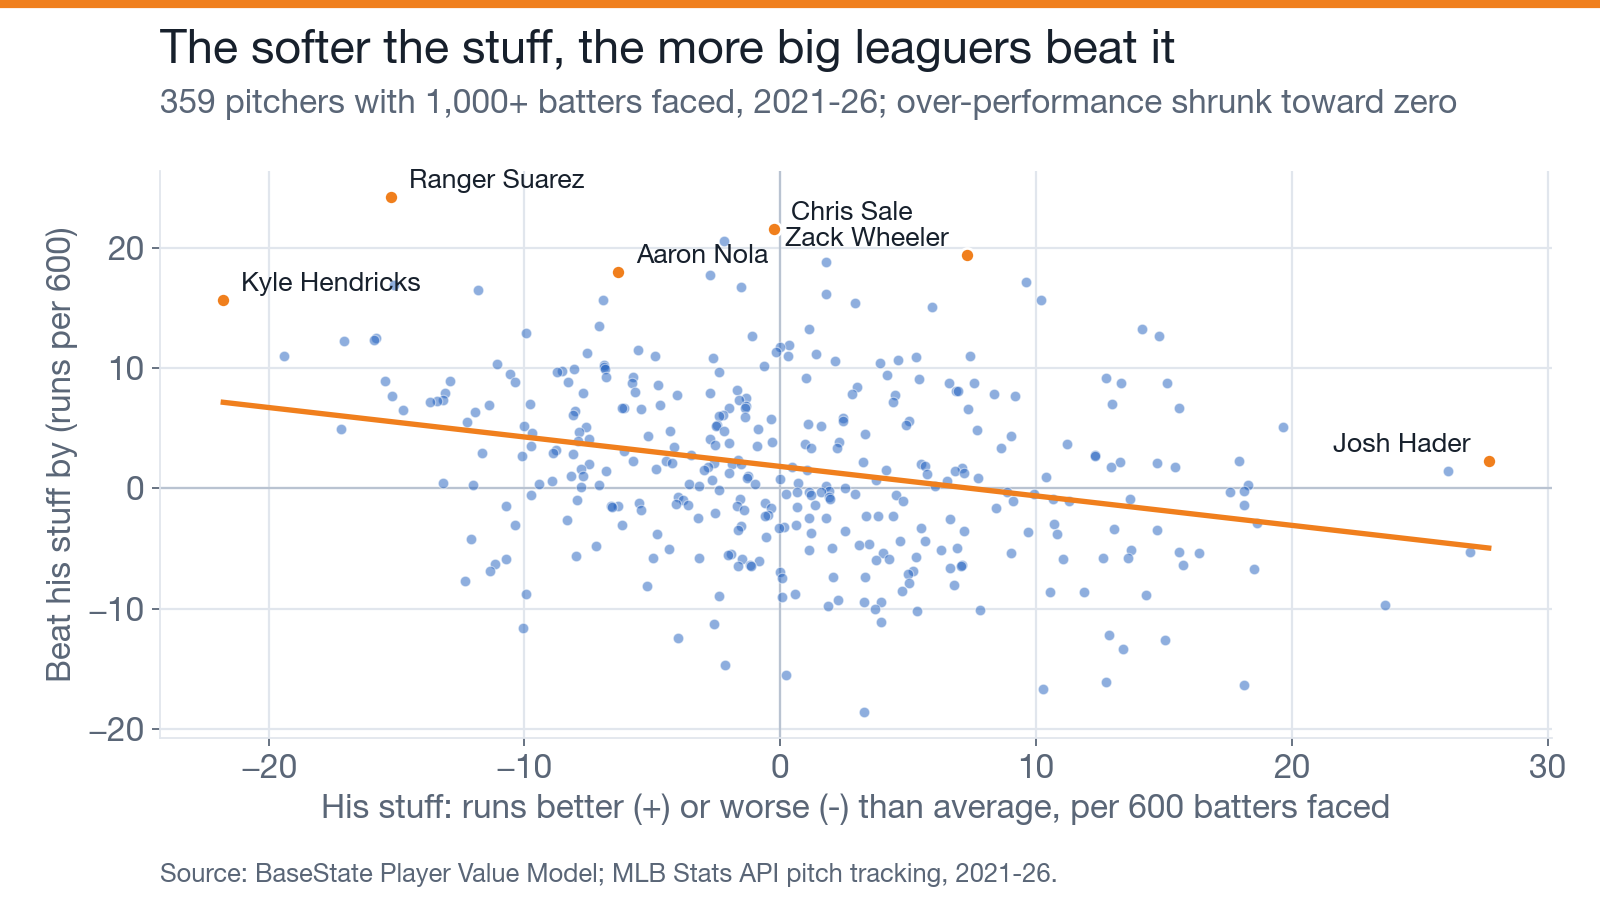
That could have been the stuff model overrating great stuff and underrating soft stuff. It isn't. When the same pitcher's stuff changes from one season to the next, a velocity gain for instance, his results move almost exactly one-for-one with it. Across different pitchers, they move only 0.73 runs per run of stuff. The gap is selection. A pitcher with ordinary stuff tends to last in the majors only if he beats it, so among big leaguers, stuff and pitchability trade off.
Where it shows up
Every pitch is a short decision tree. The hitter takes it or swings. A taken pitch is a ball or a called strike. A swing misses or makes contact; contact is foul or fair; a ball in play is hit hard or softly. We split each pitch's over-performance into those branches, so the five pieces add up exactly to the total.
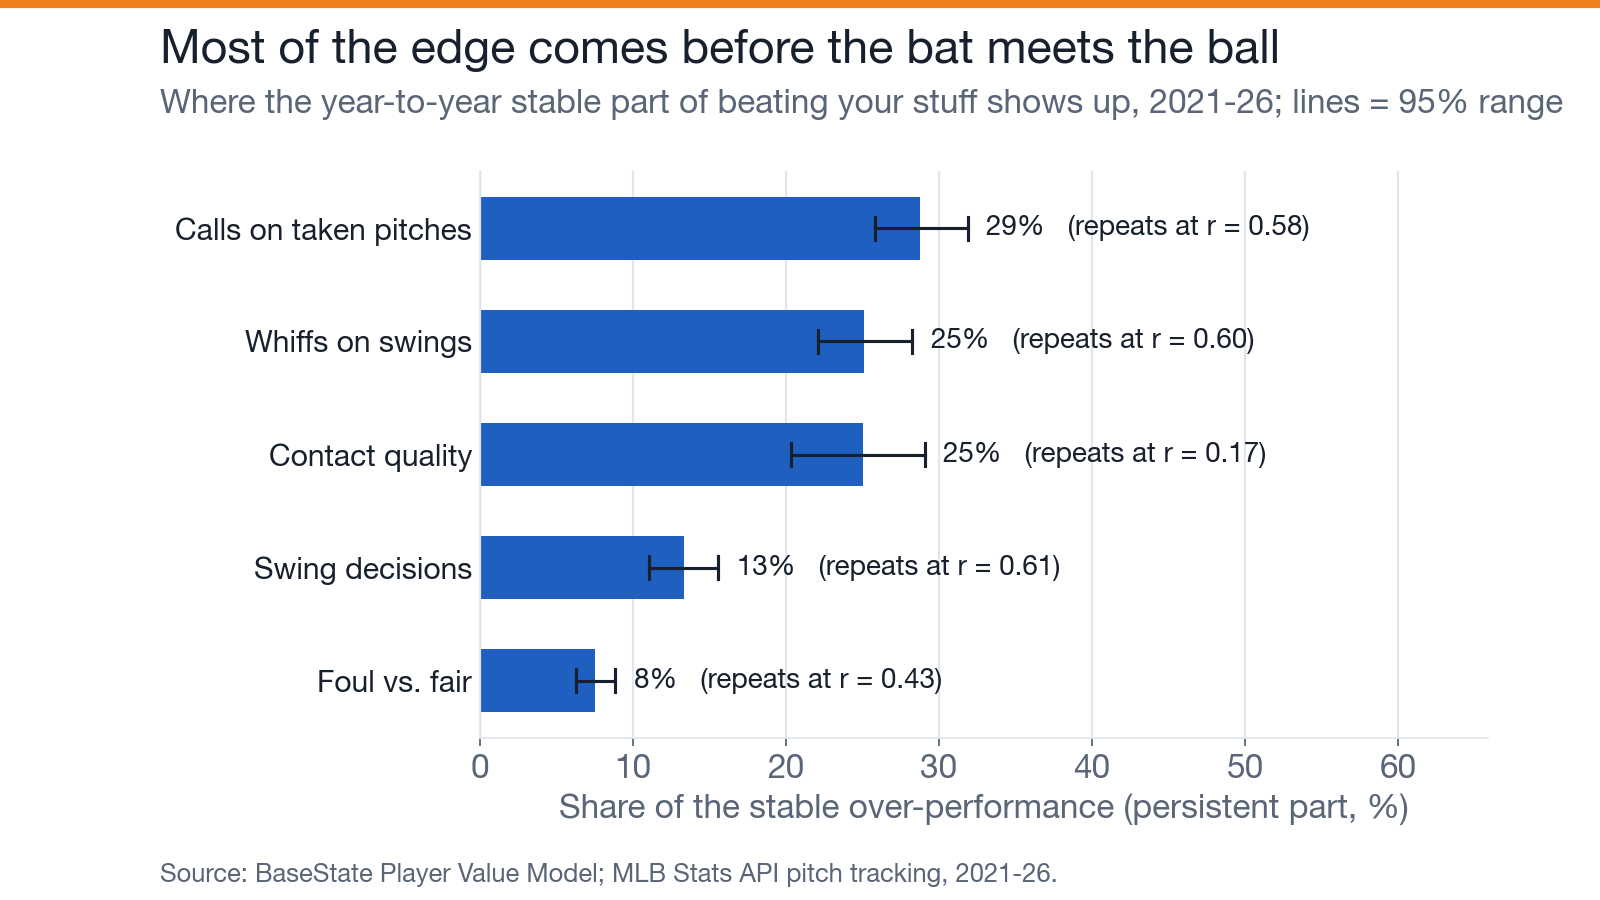
- Two-thirds of the stable edge comes before the bat meets the ball: calls on taken pitches (29%), whiffs (25%) and swing decisions (13%).
- Contact quality supplies a quarter. It barely repeats from one season to the next, but over several seasons it adds up.
- Two families. Pitchers who get strikes called on taken pitches also get swings at the right moments; both point to putting the ball in the right place. Pitchers who beat their stuff on whiffs also get more fouls and weaker contact; that points to hitters not seeing the ball well.
The best over-performers do it in different ways.
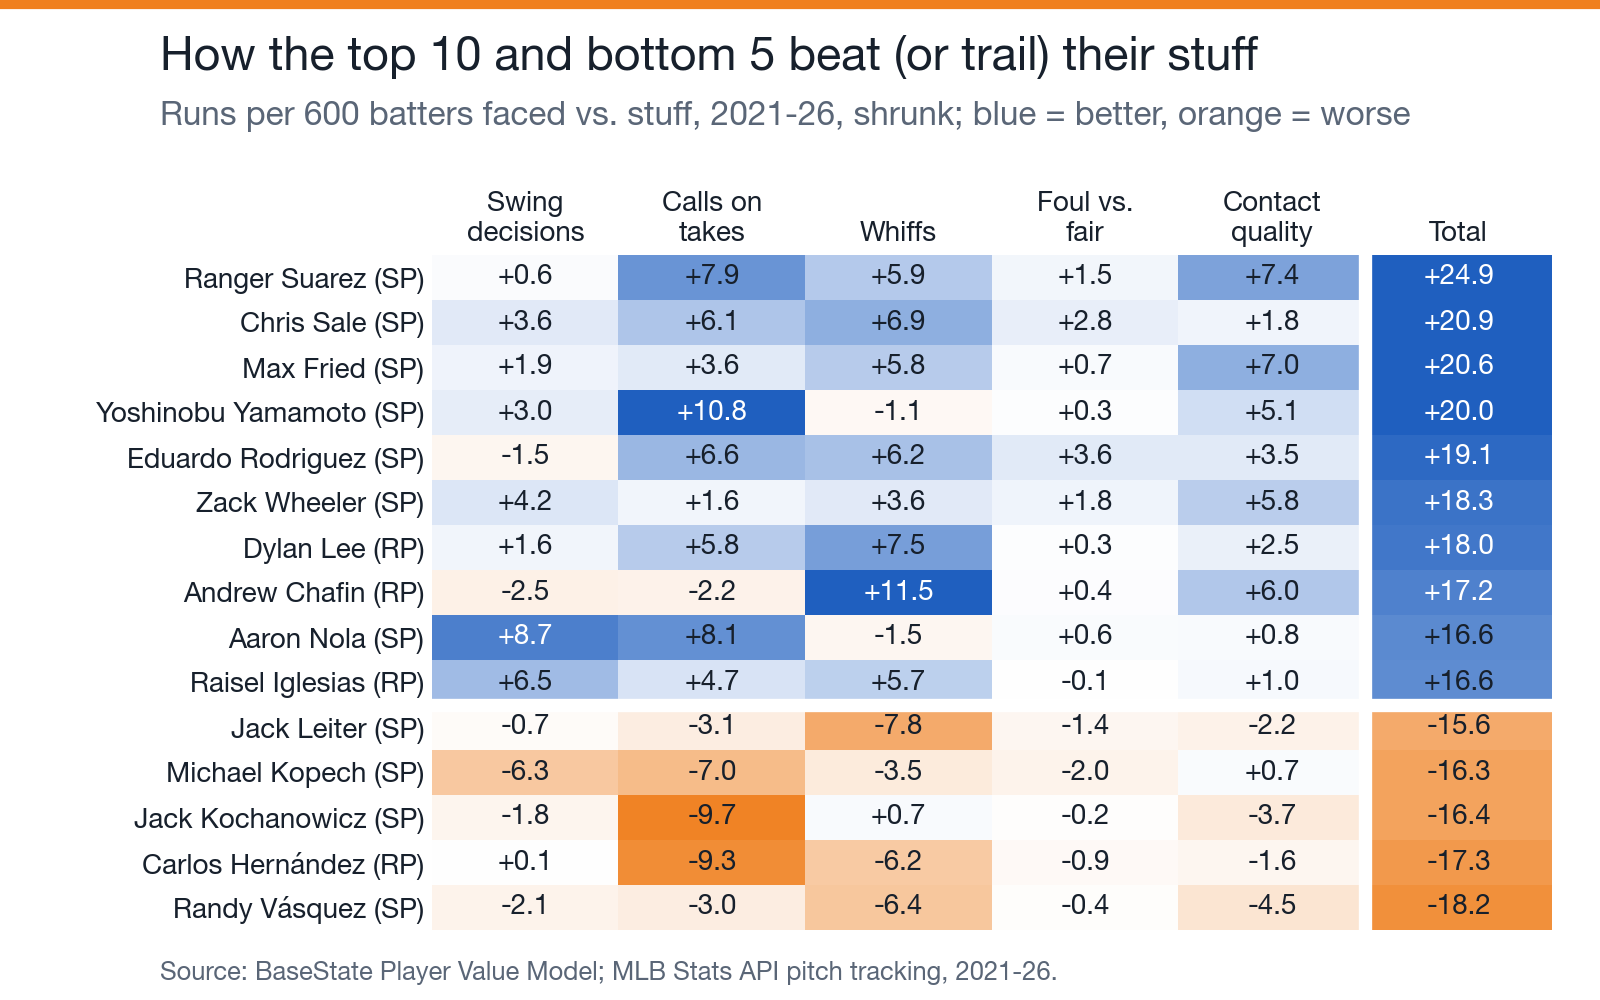
Aaron Nola is the command archetype: big edges on swing decisions and called pitches, fewer whiffs than his stuff predicts. Yoshinobu Yamamoto gets more called strikes beyond his stuff than anyone in the group. Andrew Chafin is the opposite: below par on calls and swing decisions, but an extra 11.5 runs on whiffs. Suárez and Max Fried add about 7 runs each on weak contact.

What it is: command, sequencing or tunneling?
Here is where the scouting vocabulary meets the tracking data. We added each idea to the expectation in turn, each fitted on other seasons. Command: where the pitch ends up, given its stuff. Sequencing: what the previous pitch was, how its speed, movement and location changed, and whether the hitter swung at it. Tunneling: how close the pitch looked to the previous one 175 milliseconds before the plate, when the hitter has to decide, and how far apart they finished. We also checked approach angle, how flat a pitch comes in, in case the stuff model was missing something.
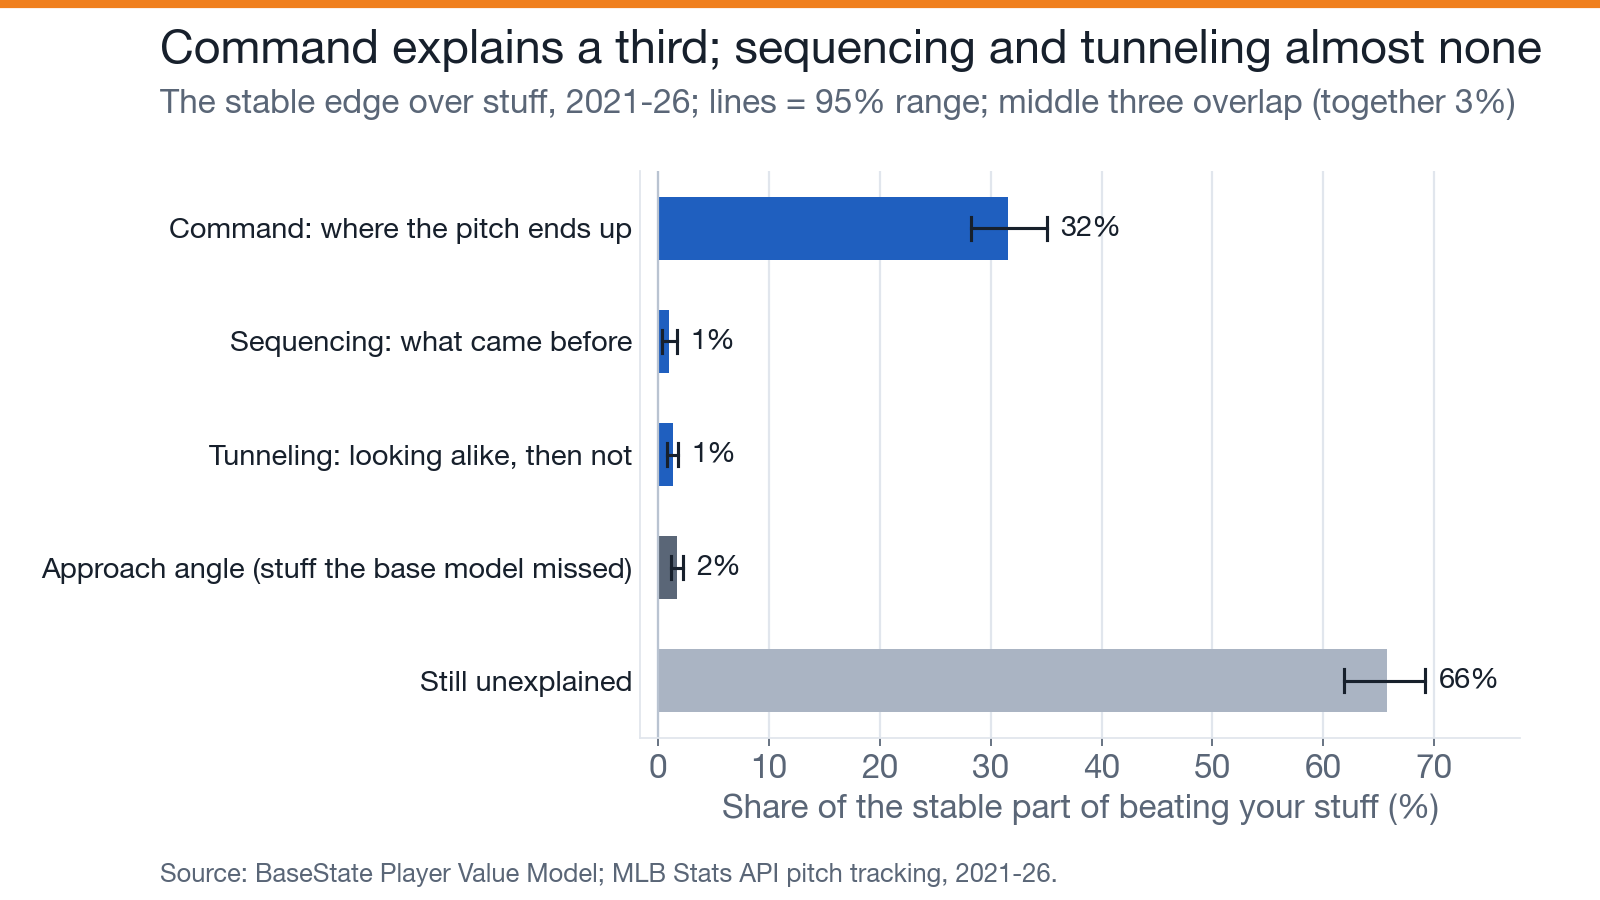
- Command is real and explains about a third (32%). A pitcher's command value repeats from year to year at 0.72. It explains 81% of the edge on called pitches and all of the swing-decision edge; it explains half the whiff edge and almost none of the contact edge.
- Sequencing and tunneling explain about 1% each. Approach angle adds 2%.
- Two-thirds is still unexplained, and it still repeats (0.36 year to year, far beyond chance). It sits in whiffs, in getting hitters to chase more than the location of the pitch would predict, and in weak contact.
We also measured six habits directly: how tightly a pitcher hits his spots, how predictable his pitch choice is, how well his pitches tunnel, how far apart they finish, and how consistent his release point is.
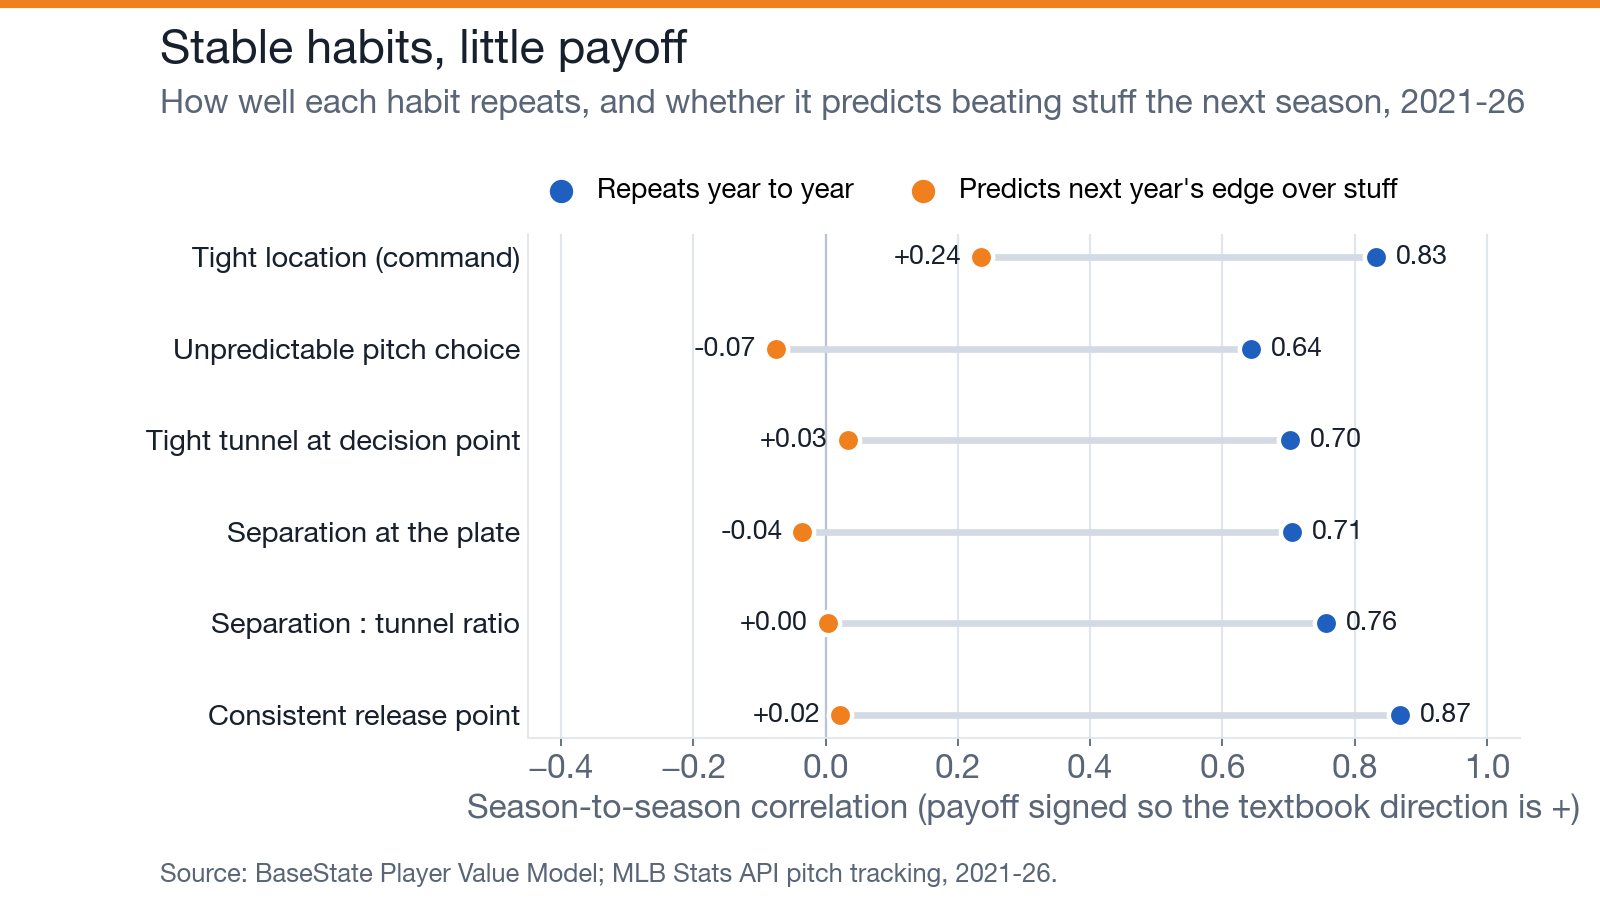
Every habit is a real, stable trait of a pitcher. Only one of them pays: hitting your spots (0.24), and even that disappears once you count where the pitches actually ended up. Tunnel distance, plate separation and release consistency predict nothing. A more predictable pitch choice goes with slightly better results, the opposite of the textbook.
Whose skill is it?
The last worry is that the edge belongs to someone else. A great framing catcher steals strikes, a good game-caller sets up hitters, and a club's pitching coaches and game plans travel with the uniform.
So we watched pitchers who changed clubs between seasons. If the edge belonged to the club, it should fade when the pitcher leaves.
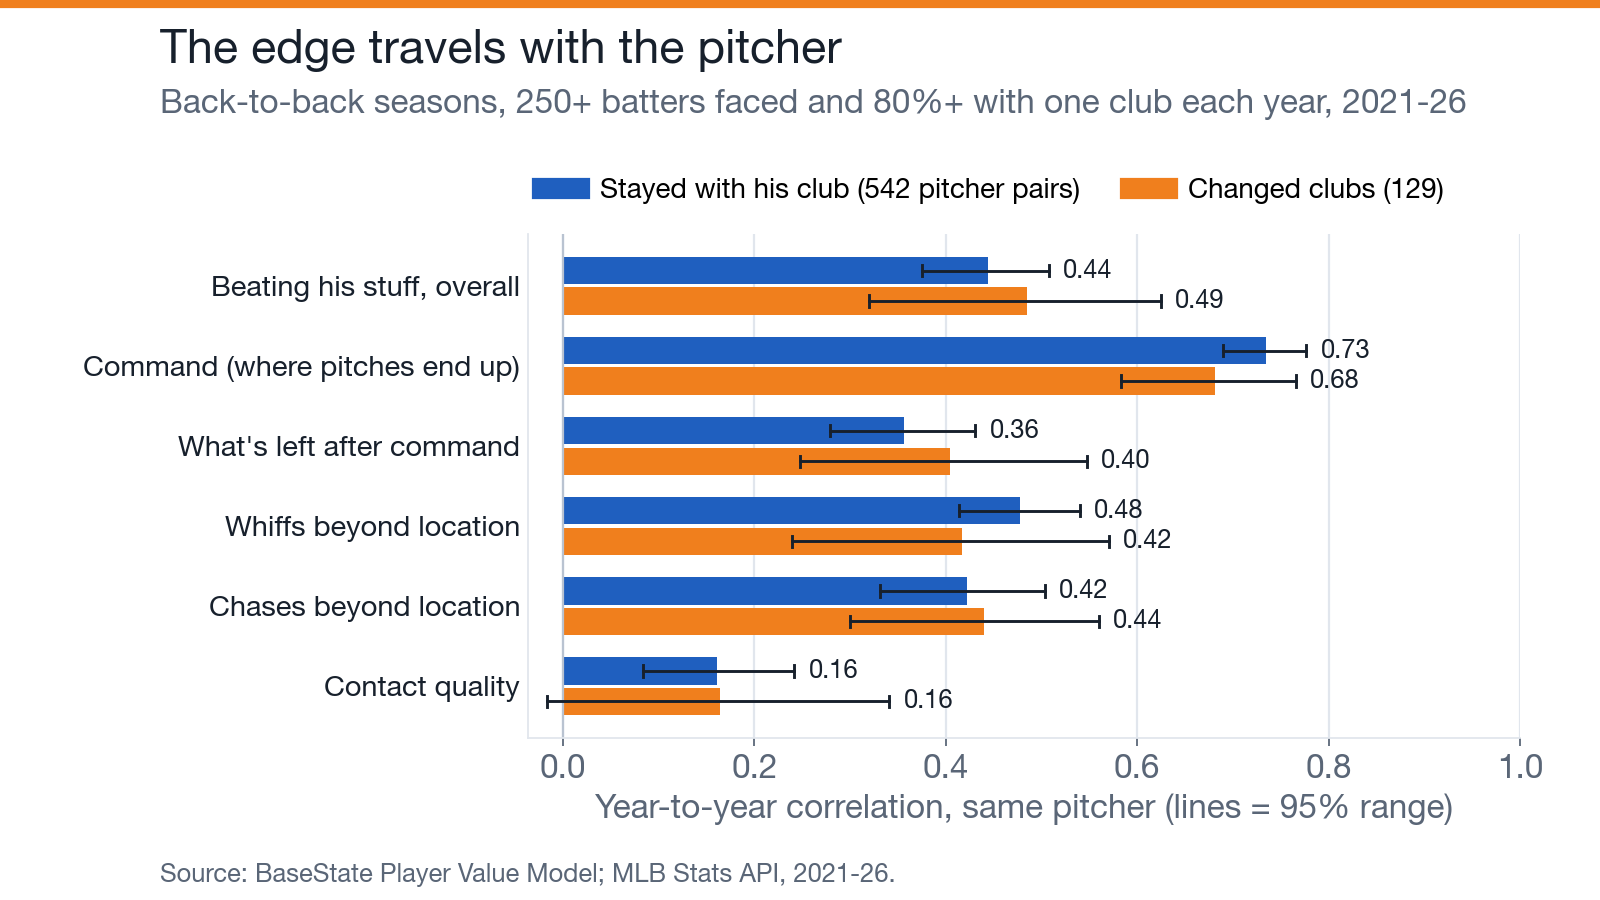
It doesn't fade. Pitchers who changed clubs repeated their edge at 0.49; pitchers who stayed, at 0.44. Command, whiffs and chases all travel. Among pitchers who stayed put, it made no difference whether their main catcher changed (0.44 either way).
We also identified the catcher behind the plate for every plate appearance and fitted pitcher, catcher, hitter and ballpark effects together.
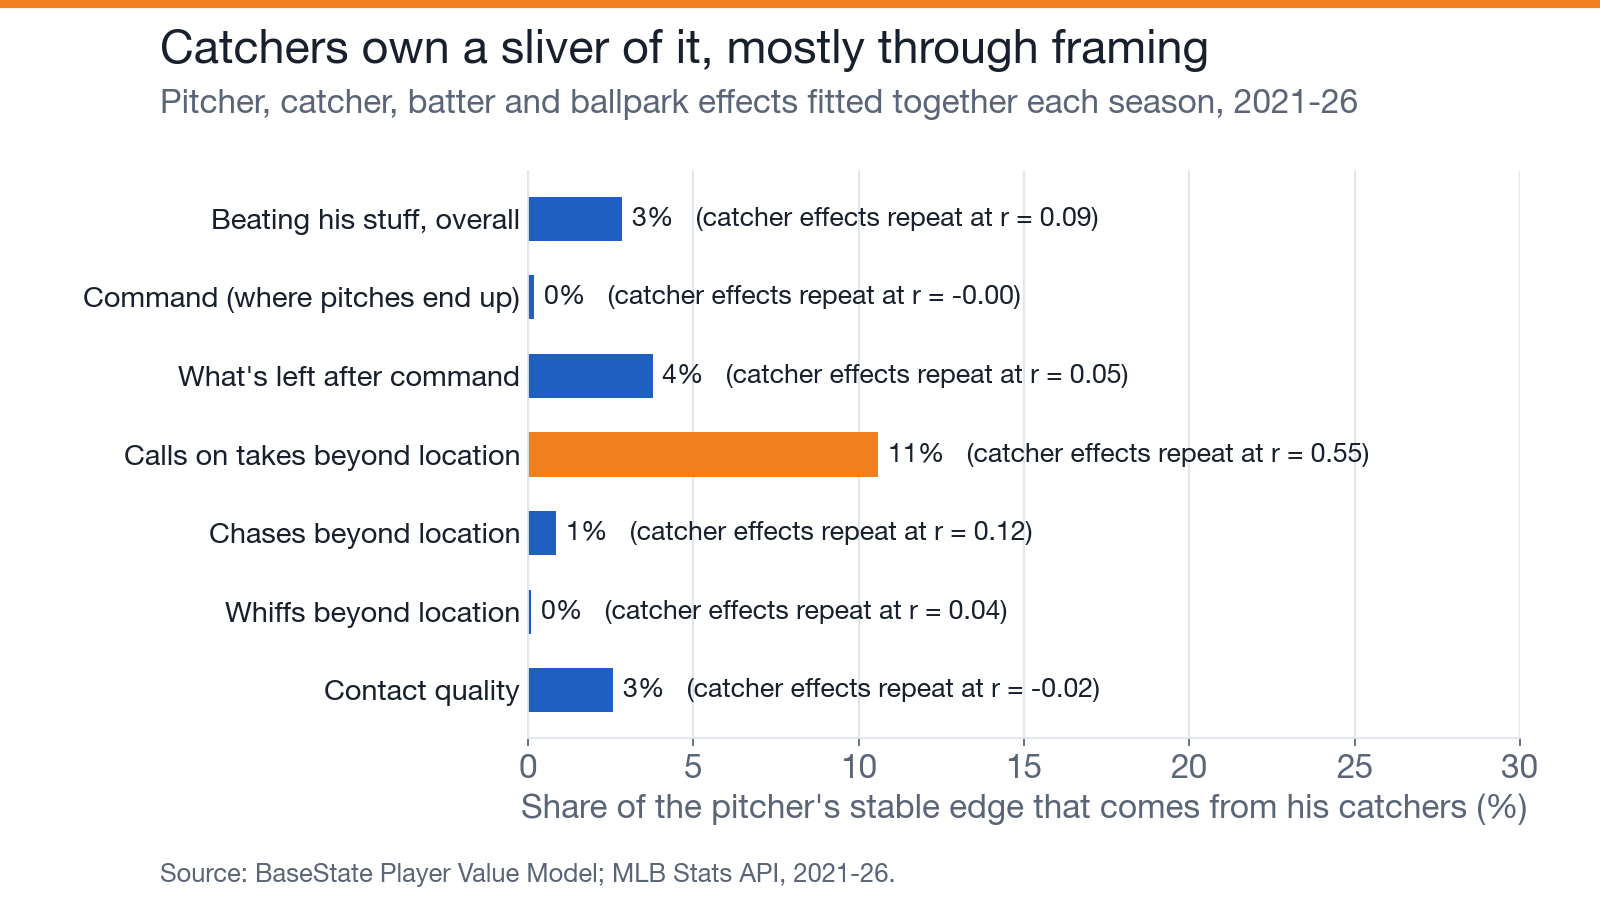
Catchers own about 3% of a pitcher's stable edge. Their one effect that repeats from season to season is framing: it accounts for 11% of the edge on called pitches beyond location, and the leaders are the names you'd expect, Patrick Bailey, Tomás Nido, Mike Zunino and Alejandro Kirk. Catchers show no lasting effect on command, chases or whiffs.
What it adds up to
Pitchability is real. Beating your stuff is a stable skill; one standard deviation of it is worth about 9 runs per 600 batters faced, roughly a season for a starter. It belongs to the pitcher, and it goes with him when he changes teams.
A third of it is command. The rest is a puzzle. Sequencing and tunneling, the two ideas most often offered to explain it, don't account for it, at least not in any form public pitch tracking can measure. What's left is stable, and it shows up as missed bats, chased pitches and soft contact. The likeliest explanations are things the ball's flight doesn't record: deception in the delivery (arm action, hiding the ball, tempo), deliberate changes of shape or speed within a pitch type, and game plans built for each hitter. Those are the scouts' words. The data says they're describing something real.
How we did it
- Pitch values come from the BaseState model (see How We Value Players and the technical white paper): each pitch's change in the count's expected strikeout and walk outcome, plus expected contact value from exit velocity and launch angle on balls in play.
- The stuff model is the BaseState model's own pitch-quality model, not Stuff+. It uses velocity, movement, spin, extension, release and gaps from the fastball, and it deliberately leaves out location. A stronger stuff model leaves less to explain; the Stuff+ box above shows by how much.
- Every season is scored by models fitted on other seasons. Year-to-year tests score both seasons with a model that saw neither.
- Chance comes from shuffling plate appearances among pitchers within each season (200 to 500 times). We also planted fake skills of known size in shuffled data: the method recovered them almost exactly, and it detects a skill of 3 runs per 600 batters 89% of the time. The real spread is about three times that.
- Adjustments: the results are centered by times through the order. Adjusting for opposing hitters and ballparks changed nothing material.
- Sample: 2021-26 regular seasons, 821 pairs of back-to-back seasons with 250+ batters faced in each, and 359 pitchers with 1,000+ batters faced for the named lists.